The VIX Cycle
The VIX Cycle should be familiar to most traders who dabble in volatility and while the VIX Cycle is easily observable and intuitively taken for granted, I haven’t really seen articles or theories that outline it or explain the reasons for it. A lot of time is spent on the math of the VIX and very little on what the math is trying to model. I am sure there are some articles or blog posts, but I haven’t really seen any that are in wide circulation. I will attempt to demystify the VIX Cycle here and explain in general terms why it exists.
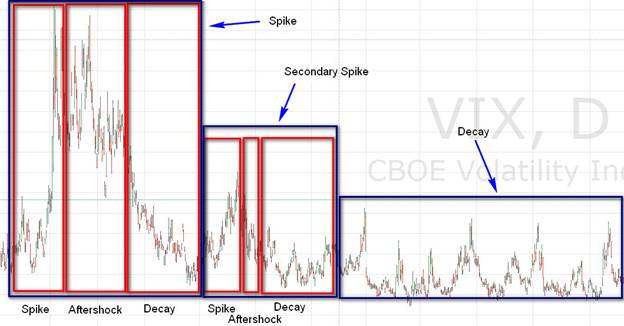 The VIX Cycle is composed of 3 phases – Spike, Aftershock and Decay. There is a Long Term VIX Cycle that encompasses months and years and there is Short Term VIX Cycle that encompasses weeks and months. Each phase in the Long Term VIX Cycle is composed of an entire Short Term VIX Cycle. Let’s go through each phase:
Spike
This happens during the first leg of a selloff and usually lasts 2-3 weeks. During the first part of a selloff, market conditions have changed dramatically and millions of investors have realized that they are holding a bag of securities that are now considered expensive. Stocks have to be repriced and they suspect that this initial price discovery phase can be quite painful. This happens rather suddenly and investors wake up one morning to find that there really aren’t any buyers. The price of the SPX free falls like a knife and nobody is stepping up to catch it for fear that their hands will get bloodied. To top it off investors have no visibility as to how long this selloff will last. It could be just a short correction, but it could be the beginning of a long bear market. Visibility is limited and when that happens, it is better to be safe than sorry, so investors protect their portfolios en masse. SPX put buying is really intense and the price of volatility premiums skyrockets. The VIX increases exponentially like a hockey stick and reaches highs unseen in a long time usually above 30 or 40.
Aftershock
After a few weeks, the selling pressure notably wanes. All those who wanted to sell have now sold. The market starts to fall off its own weight but a point is reached where it becomes really hard to push the price down any further. Shorts keep pushing and pushing and yet the SPX doesn’t go down as much anymore. Value buyers show up and snap up shares at what they consider bargain prices. Nobody wants to miss out on a bargain. Volatility during this period is still elevated as buyers show up for a couple of days but then disappear for the next few days and price still moves up and down quite a bit. There are some dead-cat bounces and miniature rallies but the price for the most part continues to go down and tests the lows achieved during the first part of the selloff. This is now more of a tug of war than a straight selloff. Actual volatility is still very elevated, BUT declining from the highs achieved during the Shock phase. As the actual volatility in the SPX declines, investors start to wonder whether it makes sense to purchase SPX puts at such a high price while the SPX is trading at such a discount. And the VIX starts to erode slowly. This period also lasts a few weeks.
Decay
At some point confidence returns for any number of reasons. The geopolitical event is resolved. Earnings have been reported and there is forward clarity. Economic data surprises to the upside. Policy makers get involved either by jawboning or announcing actual policies. Treasuries have rallied so much and the yield has gone down so much that at some point buying a dividend stock with a 4-5% dividend at 20-40% discount from an all-time high that is backed by a business with a solid moat and repeatable revenue is simply a more logical way to deploy capital. The buyers show up and start to buy and support stock prices. The buyers can be corporate insiders who oversee tens to hundreds of product lines who perform basic cash flow analysis and whose analysis tells them that the stock is cheaper than the net present value of the cash flows. Or it could be value buyers that do it based on metrics such as price to earnings, price to sales, price to cashflow, etc. Or it could be macro buyers that do it based on comparison between bonds and stock dividend yield. In any case, many buyers now show up and provide a solid and uninterrupted bid. At some point prices move up high enough and break through key technical levels that the momentum and technical trend buyers now show up. During this period, investors are pretty much convinced that the worst is behind them and don’t want to purchase insurance via SPX puts anymore. Actual SPX volatility and the VIX drop off dramatically and stay down for an elongated period of time.
In the Longer Term VIX Cycle, a few months later, there is another pocket of heightened volatility, because prices never go straight up and market conditions coalesce around another smaller high volatility period. But at that point, the VIX only does a 30-50% retrace to the previous high achieved during the initial Spike phase and once this Secondary Spike (or Aftershock) phase ends another even more elongated Decay phase starts.
SPX Puts Are Portfolio Insurance
Still, why aren’t the VIX Cycles a little less “spikey”? Why does the VIX have to spike so intensely like a heartbeat in the beginning and then spend a long time in decay? Why aren’t investors buying insurance when it is cheap and selling it when it is expensive and thereby negating the extreme skewness of the VIX distribution?
 Well, the answer lies in how the investment management industry operates. Majority of the investment managers out there have trillions of dollars invested in various stocks and stock derived instruments such as ETFs and futures. The reason why anybody invests in stocks over bonds or gold is simple – a stock can have a yield just like a bond, but that yield can increase over time because a business can create additional value and additional dividends by entering new business lines over a long period of time. I don’t want to go into a long diatribe about stocks, the point is that stocks are a financial instrument with distinct properties and as such the vast majority of the investment management industry is LONG stocks. So when, the industry faces a repricing period, they really don’t want to sell their stocks because they have to give up the dividend yield, instead they choose to insure their stocks. They do that by buying SPX puts which are the most liquid options out there and feature the lowest bid-ask spread (in other words, they are priced most efficiently).
Portfolio Insurance Costs Money and Affects Returns Negatively
So you really have to think of the SPX puts as portfolio insurance and the VIX simply as the cost of portfolio insurance. Cost of insurance is one of the three main costs that an investment management business incurs along with the cost of capital (interest rate) and the cost of acquisition of capital (sales, marketing and technical platforms that enable customer retention). While the cost of capital and cost of capital acquisition are fairly stable and can be brought down via efficiencies, the cost of insurance depends on market conditions. Investment management companies try to keep the cost of insurance as low as possible because it affects their profitability.
Hedging via SPX puts is very expensive. Options have a built in time value that erodes over time. Options have to be rolled over. The trading costs associated with options are not insignificant. So managing this insurance cost is very important and a lot of time is spent on optimizing it. Since portfolio insurance reduces returns, portfolio managers will delay the purchase of insurance until the very last moment. They will also buy only if there is a really good reason to buy insurance. An appropriate analogy for this behavior is this: if the portfolio was a house, the fund manager will not buy house insurance until the 100-mph wind hurricane is within a couple of miles from the property. At the very last moment, when it is clear that the hurricane will hit the house is when the fund manager buys insurance. After the hurricane is gone, the fund manager collects the insurance payout and doesn’t buy insurance until another hurricane shows up within a mile of the property. There are a lot of hurricanes regularly and there may be some insurance buying here and there, but umbrella insurance (all-encompassing portfolio insurance) is only bought when the hurricane is within sight. So this delayed insurance buying performed in select moments is what leads to these intense VIX spikes and subsequently to long decays. It is important to understand that after portfolio managers have been paying heightened insurance premiums for 2-3 months, much less 4-6 months, they become extremely reluctant to continue to purchase puts at a high price. The world has to be coming to an end for them to continue to pay for insurance through the nose.
So the VIX Cycle represents behavior that is not going to change any time soon and has been true for as long as the VIX has been around which is now in excess of 20 years. The VIX Cycle is here to stay and understanding it and respecting it will help you as a trader and investor.
Power of the VIX Futures Curve
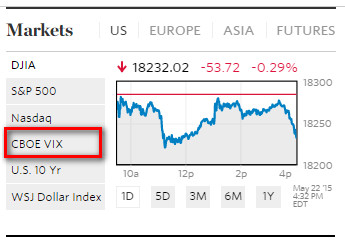 While the mass media suppresses any useful information regarding the proper use of the VIX, the CBOE VIX is so
important that it is the 4th most quoted financial number out there after the Dow Jones index, the S&P 500 index and the NASDAQ index. The excerpt on the right
is from the front page of the Wall Street Journal, the premier financial newspaper in the United States.
While the mass media suppresses any useful information regarding the proper use of the VIX, the CBOE VIX is so
important that it is the 4th most quoted financial number out there after the Dow Jones index, the S&P 500 index and the NASDAQ index. The excerpt on the right
is from the front page of the Wall Street Journal, the premier financial newspaper in the United States.
To properly trade volatility and the S&P 500 index successfully, you need to go one step further and understand the VIX Futures Curve. The CBOE provides a market for futures of the VIX, which are bought and sold
by professional investors. The VIX futures market along with the S&P 500 index futures market is the most liquid market on Earth. Millions of investors buy or sell VIX futures with the purpose of protecting
their portfolios against loss or simply for speculation. A market that deep provides a very valuable insight about what the totality of market participants think about where the stock market is headed.
The VIX is an index of the amount of S&P 500 index put and call options purchased at any given point in time. Most institutional investors (mutual funds, proprietary trading desks, etc) hold stocks directly and protect their entire portfolios by buying a broad S&P 500 index put.
Option buying activitiy in the S&P 500 index is primarily centered around put buying. As a result, significant increase in the VIX index usually happens when investors purchase puts. Investors purchase puts en masse when they think the market
is in immediate danger of falling. Panics happen suddenly and quickly and as a result the VIX is prone to massive spikes. When they occur is hard to tell, but usually if there is some
big event with a large macro economic effect, the VIX will spike as investors rush to protect their portfolios.
Monitoring the VIX gives you an insight into market participants expectations for the future. The VIX measures 30-day volatility expectations. There are
additional CBOE products that measure volatility expectations over different time frames. The VIX9D measures 9-day volatility (2 weeks). The VIX3M measures 3 month volatility. The VIX6M measures 6 month volatility.
The VIX Futures Curve provides insight as to where the market thinks the VIX will be at certain points in the future and by deduction the S&P 500 index
In addition to the various VIX indexes, the VIX Futures market provides additional insight. The VIX futures expire every month and at any one point, there are 8 futures contracts available for trading. The price
distribution of these future contracts is the VIX Futures Curve. Because of the monthly spacing of the VIX future contracts,
the VIX Futures Curve provides additional insight as to where the market thinks the VIX will be at certain points in the future and by deduction the S&P 500 index.
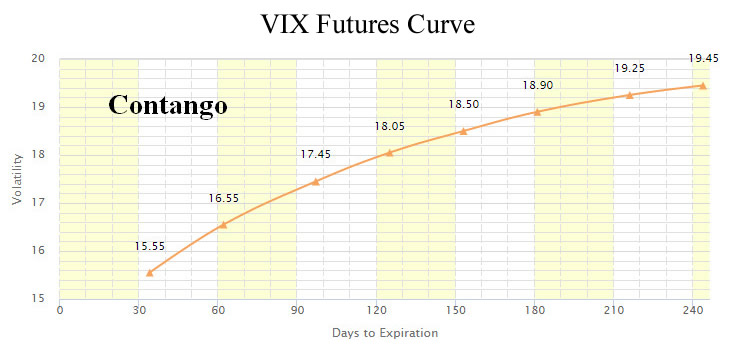
The Importance of Contango
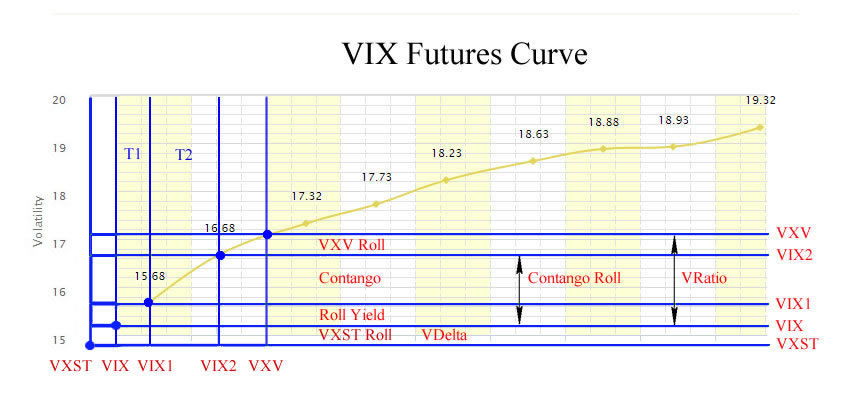
The futures curve depicted above is the usual distribution of prices for the VIX. The VIX index was designed to be mean reverting so by definition any time the
VIX trades at levels below the historical average (which is 20), the market anticipates that the VIX will rise in the future to reach that historical average. In fact, if there was an infinite VIX future, it's value
will be the historical average. The condition when second month VIX future (VX2) is higher than
the front-month VIX future (VX1) is called Contango. So when the VIX Futures Curve in the above formation, it is considered to be in Contango formation.
When the situation is reversed and VX2 is smaller than VX1, then the VIX Futures Curve is usually in the below formation which is called Backwardation.
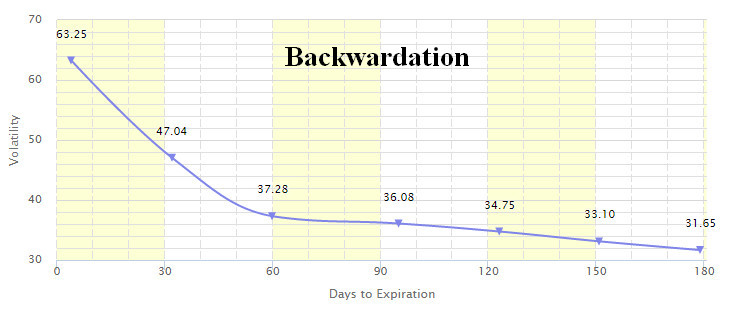
When the VIX Futures Curve goes into backwardation, this is a very important moment for the S&P 500 index. It means that totality of market participants think the VIX will be lower in the future.
In other words, they anticipate investors will buy less puts in the future. That means that investors think that the drawdown is over. When market participants think calmer times are ahead,
the SPY finds a solid footing, carves out a bottom and starts a rally.
95% of drawdowns end a day or two after the VIX Futures Curve slides into backwardation
And like clockwork, most drawdowns end a day or two after the VIX Futures Curve
slides into backwardation. While that is the case 95% of the time, there have been occassions in the past, when drawdowns haven't ended on entering backwardation. Prolonged periods of backwardation mean the market
is experiencing unusual levels of stress. Such periods were the Lehman bankruptcy in 2008 and the US government downgrade from AAA status in 2011. Usually when that happens, you want to be out of the market completely, in cash and waiting for
the situation to settle. Periods of backwardation do not happen very often. In the past 10 years, there has been a total of 6 months of time when the VIX Futures Curve has been in backwardation state.
Fair Value of VIX Futures
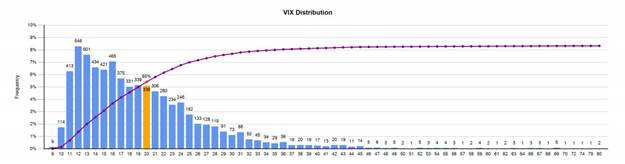
Since the inception of the VIX Futures in 2004, the average Contango between VX1 and VX2 has been around 5.6%. The VIX spends most of its time declining from elevated levels. While
the average VIX is around 20, the VIX has spent 60% of the time below 20 since its inception in 1990. Since the bull market start in 2009 and the beggining of active Central Bank suppression of volatility that percentage is even higher at 65%. Since 2012 once the AAA downgrade episode passed and QE Infinity was announced, the VIX has spent a remarkable
92% of the time below 20!
However, the question remains "Why does a low spot VIX result in a high contango in the VIX Futures market?". The answer can be found on the VIX Primer page on CFE VIX Futures site where they explain how to calculate the Fair Value of a VIX Future. I am going to shamelessly reprint their content here in case they take down the page.
Fair Value of VIX Futures
Futures traders are most familiar with the fair value of stock index futures derived from the cost-of carry relationship between the futures and the underlying stock index. Since there is no carry between VIX and a position in VIX futures, the fair value of VIX futures cannot be derived by a similar relationship.
Instead the fair value is derived by pricing the forward 30-day variance which underlies the settlement price of VIX futures. The fair value of VIX futures is the square root of this expected variance less an adjustment factor which reflects the concavity of the square root function used to extract volatility from variance. In percentage points, the fair value of VIX futures is:

In this expression, Pt is the forward price of de-annualized variance in the 30 days after the futures expiration, and -vart[FT] is the concavity adjustment. The adjustment subtracts the variance of the futures price at expiration, which can also be expressed as the cumulative daily variance of VIX futures from the current date to expiration.
Using methods similar to those on which the calculation of VIX is based, the forward price of the 30-day variance can be determined from a synthetic calendar spread of S&P 500 options bracketing the 30 days after the futures expiration. The variance of the futures price can be estimated from historical data on the daily variance of VIX futures.
I don't want to go into deep mathematical analysis here, but the end result of that calculation is that a VIX Future contract over the long term tries to reach the average spot VIX value.
The farther out in time the future, the closer the fair value will be to the average historical VIX value.
The delta between the future price approximation and the average value goes exponentially closer to zero.
The flipside of that calculation is that the nearest term VIX future has the largest difference to the long-term average,
the second term VIX Future - the second largest difference,
the third term VIX Future - the third largest difference, etc.
The exponential decline in the delta can be plainly seen in the usual VIX Future Curve formation depicted above (Contango formation).
Since the inception of the VIX Futures in 2004, the average Contango between VX1 and VX2 has been around 5.6%. Since onset of QE Infinity in 2012, Contango has averaged 7.2%
For practical purposes, what is important to remember out of all this is that average Contango ends up being a pretty significant percentage.
Volatility Curve Formations
The Volatility Curve is a combination of the VIX Futures Curve (VX1 - VX8) and the spot volatility indexes (VIX, VIX9D, VIX3M, VIX6M)
| VDelta > 1 |
Roll Yield > 5% |
Contango > 5% |
Contango Roll > 10% |
VRatio > 1.1 |
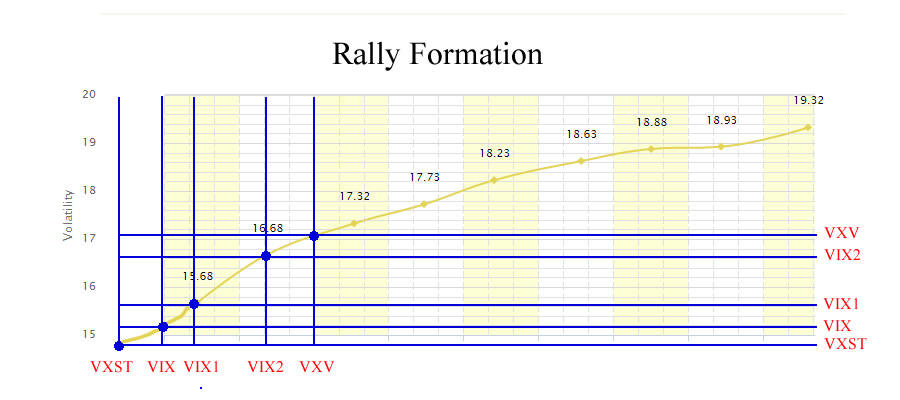
In a "Rally" Formation, the nearer-term volatility indicators are smaller than the longer term indicators. This means that investors are pretty complacent at the moment and are more worried
about the future, which is the natural state of affairs. The VIX is meant to be mean reverting so if the spot VIX and VXST is low, the futures are going to be logarithmically bigger over time so as to reach the
historical average of the VIX which is around 20. In a rally formation, VDelta is bigger 1, Contango and Roll Yield are very healthy above 5% and VRatio is bigger than 1.10. All indicators across the board are in
green. When Contango and Contango Roll > 10%, you can expect healthy daily gains in the SVXY.
| VDelta < 0 |
Roll Yield ~ 0% |
Contango < 5% |
Contango Roll < 10% |
VRatio < 1.1 |
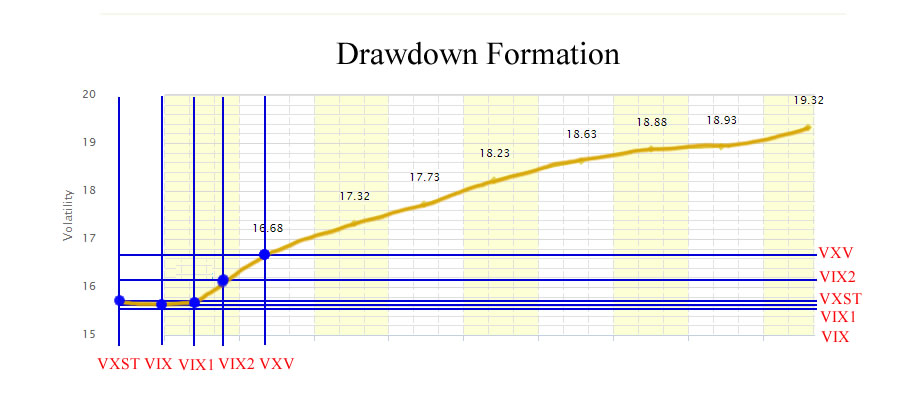
In a "Drawdown" Formation, VIX9D goes ahead of the VIX suggesting that investors are actively buying shorter term puts in order to protect against a short-term market correction.
Roll Yield is at this point barely positive and Contango is still positive but far from elevated levels suggesting that investors are worried but are far from panicking.
In a drawdown formation, VDelta is negative and flashing red, Contango and Roll Yield are below 5% and VRatio is less than 1.10 - all flashing yellow.
In this situation, the SVXY is starting to lose its contango edge and starts to fall at the mercy of spot VIX.
SVXY will stay even or lose a little bit, but any dissipation of investor worries and subsequent market bounceback will provide a nice daily SVXY gain.
However, the closer Contango and Daily Roll get to 0%, the smaller impact of Contango is on the SVXY and the bigger is the impact of spot VIX which can jump rapidly.
So, if this condition persists and volatility rises, the SVXY becomes very vulnerable to a sharp pullback.
| VDelta < -0.5 |
Roll Yield < 0% |
Contango < 0% |
Contango Roll < 0% |
VRatio < 1.0 |
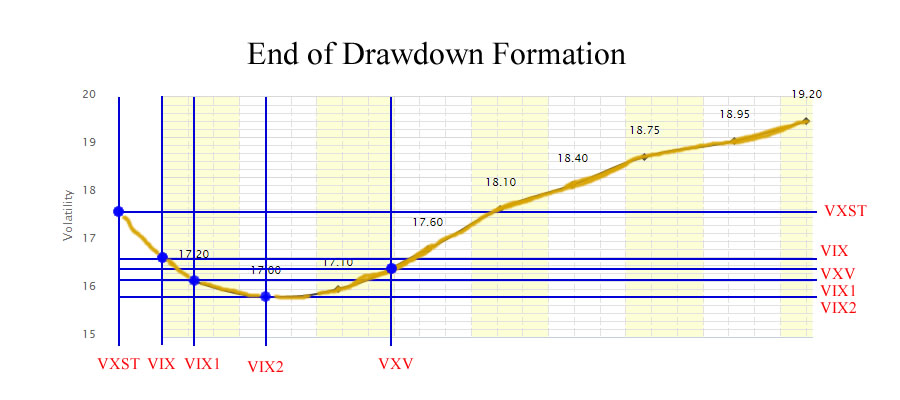
In an "End-of-Drawdown" Formation, VIX9D is now way ahead of the VIX suggesting that investors are starting to panic. Roll Yield is negative at this point as is Contango and the VRatio is now less than 1, which suggests that 30-day volatility expectations are higher than the 90-day ones.
However, the long end of the curve is still rising and higher than current VIX levels, making the curve make what some call a "smile". When the VIX Futures Curve smiles at you, it is time to buy stocks!
Put buying is reaching a climax and the formation is telling you that
at this point investors are worried more about the present than the future.
This is clearly a pivotal point especially if it only lasts a day or two.
SVXY has completely lost it's contango edge, which now is a headwind.
At this point VIXY stabilizes and starts to rise daily because of backwardation the way SVXY rises during the Rally Formation.
However, this is the best point to enter into an SVXY long as any stabilization of the
volatility conditions will lead to a massive spot VIX drop and as a result a massive one or two day rally in the SVXY.
However, if conditions worsen and the VIX continues to spike, that means investors are really in a panic mode.
At that point the VIX can post 50-100% daily spikes and as a result the SVXY can lose 40% in a day easily.
So if you put some money down, it should be a measured amount. You really want to see the rally stop and reverse over a period of 3-4 days before jumping in with both feet.
| VDelta < -1.0 |
Roll Yield < -5% |
Contango < -5% |
Contango Roll < -10% |
VRatio < 0.9 |
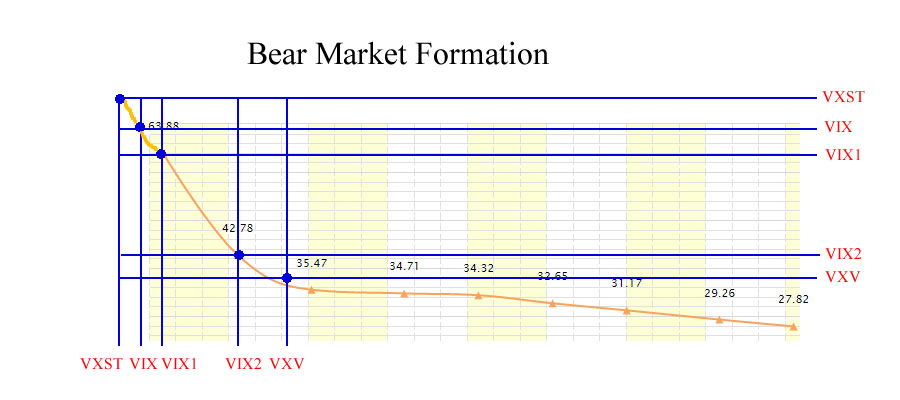
In a "Bear Market" Formation, the VIX9D is way ahead of the VIX which is way ahead of the VX1 which is way ahead of VX2, etc. VDelta, Roll Yield, Contango, Contango Roll are all solidly negative and VRatio is well below 1. The entire VIX Future Curve is now
sloping down on a slippery slope with the back end of the curve desperately trying to get down to the historical average of 20. At this point, backwardation is a major tailwind for VIXY and a major headwind for SVXY. You do not want to be a hero and try in any form or fashion to try and pick a bottom,
because there is no bottom. This is Lehman in 2008, this the AAA-downgrade in 2011 and the short volatility ETF/ETNs like SVXY lost 90% of their value in a few short weeks. The market is easily past the 10% correction mark and most likely
past the 20% drawdown signifying a bear market. Bear markets can last 6 months or more so there is no need to put any money at risk. You need to wait for the situation to settle down for a few months first. You can invest and average down in solid
companies that are clearly underpriced, but for leveraged long market ETFs and short-volatility ETFs there will be better times ahead. You need to wait for the VIX Futures Curve to "smile" at you again. Until it smiles, stay out if you are long.
If you are shorting the market, now is the time to do it and short every minor rally.
| VDelta > 0 |
Roll Yield ~ 0% |
Contango < -5% |
Contango Roll > -10% |
VRatio ~ 1.0 |
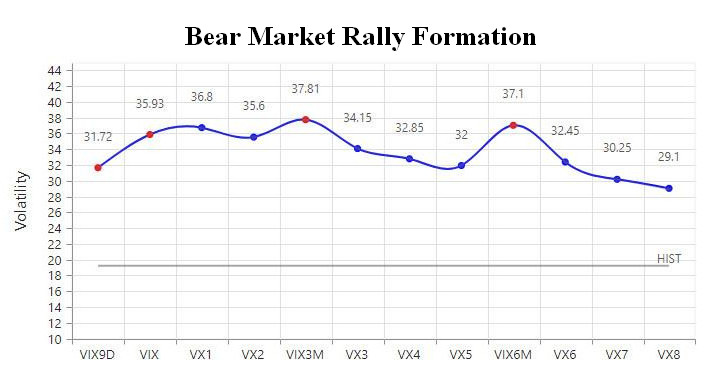
In a "Bear Market Rally" Formation, the VIX9D is below the VIX which is around or below VX1. VX1 however is higher than VX2 and higher than VIX3M and the rest of the VIX Futures Curve.
VDelta and Roll Yield are positive while Contango, Contango Roll are negative. VRatio is around 1.
The front of the Volatility Curve is flat to steepened while the back of the curve remains inverted. It kind of looks like an inverted smile or a hump. The entire VIX Future Curve is likely very high above 20
as we are still recovering from a very serious drawdown and volatility remains elevated. Volatility expectations on the front of the curve are declining as investors
see smaller near term risks because either stock prices have gotten really cheap or there is simply exhaustion from a period of high volatility. After a big drawdown,
investors know there is a snapback rally and pull their hedging activity for the very near term (VIX9D). However, concerns remain over the next 1-2 months including the prospect of another
pullback and that is why they are willing to pay up for VIX and VX1. Over the long term, investors think that volatility will mean revert down to its long term average and that is why
the back of the curve remains inverted.
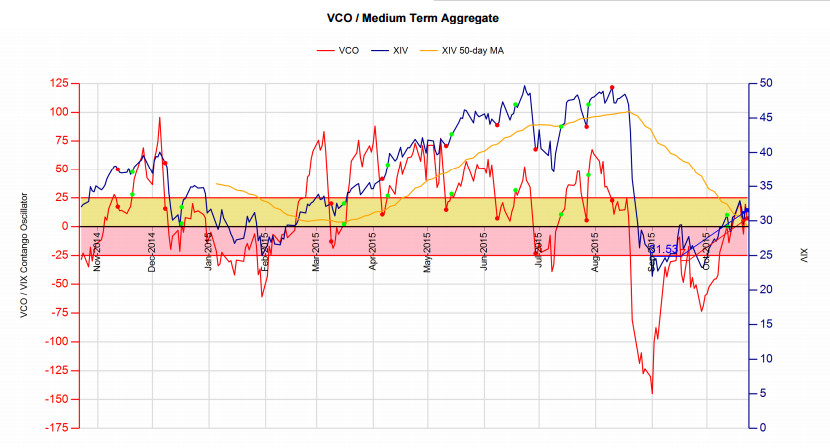
VIX Contango Oscillator (VCO)
A market timer and swing trader in the SVXY and SPY needs a way to determine when to get in on a swing trade and when to get out.
To help determine those entry and exit points, in May of 2013, I created the VIX Contango Oscillator or VCO for short.
I wrote an article about it at the time which you can still read on Seeking Alpha here.
I and hundreds of other investors have since used the VCO and have found it to be very useful in timing the market.
The VCO uses a formula that includes the VIX, VIX 1 (Front Month VIX Future) and VX2 (Second Month VIX Future).
These 3 market indicators represent market participants volatility expectations for the near future over various terms (lengths of time).
 When combined together they can be used as a definitive aggregate measure of volatility expectations.
That measure then can be used to spot turning points in the stock market. If future expectations for volatility are coming down,
the market will definitely stop going down, carve out a bottom and push higher. If future expectations for volatility are elevated,
that doesn't always translate into a market drop, but when these expectations reach a crescendo, a near term market top is almost always near.
You can think of the VCO as a temperature indicator for the stock market. When it is high, the market is hot and overbought. When it is low, the market is cold and oversold.
When combined together they can be used as a definitive aggregate measure of volatility expectations.
That measure then can be used to spot turning points in the stock market. If future expectations for volatility are coming down,
the market will definitely stop going down, carve out a bottom and push higher. If future expectations for volatility are elevated,
that doesn't always translate into a market drop, but when these expectations reach a crescendo, a near term market top is almost always near.
You can think of the VCO as a temperature indicator for the stock market. When it is high, the market is hot and overbought. When it is low, the market is cold and oversold.
VIX Contango Oscillator Formula
The VCO is an oscillator that combines the 2 factors most relevant to the SVXY - the Contango and the spot level of the VIX.
It gives majority of its weighting to the Contango (the 30-90 day volatility expectations). The formula for the VCO is as follows:
VIX Contango Oscillator = VIX - 45 + 1000 * (VX2/VX1 – 1)
or in other words
VIX Contango Oscillator = VIX - 45 + 1000 * Contango
Note 1: On 6/25/2015, the VCO formula was changed to use the VX1 and VX2 continuous contracts retroactively. During option expiration week when T1 < 5 (there is less than 5 days left till VX1 expiration), instead of VX1 and VX2, the formula
now uses VX2 and VIX3 respectively.
Note 2: On 7/22/2015, the VCO formula was changed to use the VX1 and VX2 continuous contracts retroactively. When T1 < 10 (there is less than 10 days left till VX1 expiration), instead of VX1 and VX2, the formula
now uses VX2 and VIX3 respectively.
This is commonly called a "Panama" implementation of the VX1 and VX2 continuous contract. The reason for this change is that
VX1 becomes very volatile during option expiration week. It tries to stick to the VIX resulting in high fluctuations of the VCO which don't represent actual changes in volatility conditions.
VIXY/SVXY also have less than 20% weight in VX1 futures by that point as well so the VX1 fluctuation doesn't affect them as much.
By moving to continuous contracts, the goal is to make the VCO less volatile and have it represent volatility conditions more accurately.
When the VCO hits 0 or goes from negative to positive, usually the bottom of a drawdown is near or has already been struck.
When the VCO goes above 25, we have a rally under way. When the VCO hits 100, that represents a crescendo in volatility expectations
(complacency now but high fear of the future) and can be used to spot near term tops. High VCO (above 25 but below 100) is best for SVXY
as the spot VIX is low but the VX1 and VX2 are elevated. To use the volatility terminology, both Roll Yield and Contango are high
(or the combined measure - Contango Roll is high). When that is the case, the SVXY will obviously gain from the daily shorting and covering
because of Contango. However, as the VX1 option expiration nears, the difference between VIX and VX1 (Roll Yield) must decrease and go down
to zero. However, futures expectations haven't exactly changed. What happens then is that the VX1 starts to go down to match the VIX and
then Contango gets bigger and bigger. In other words, the Contango Roll turns into Contango as the Roll Yield decreases to zero.
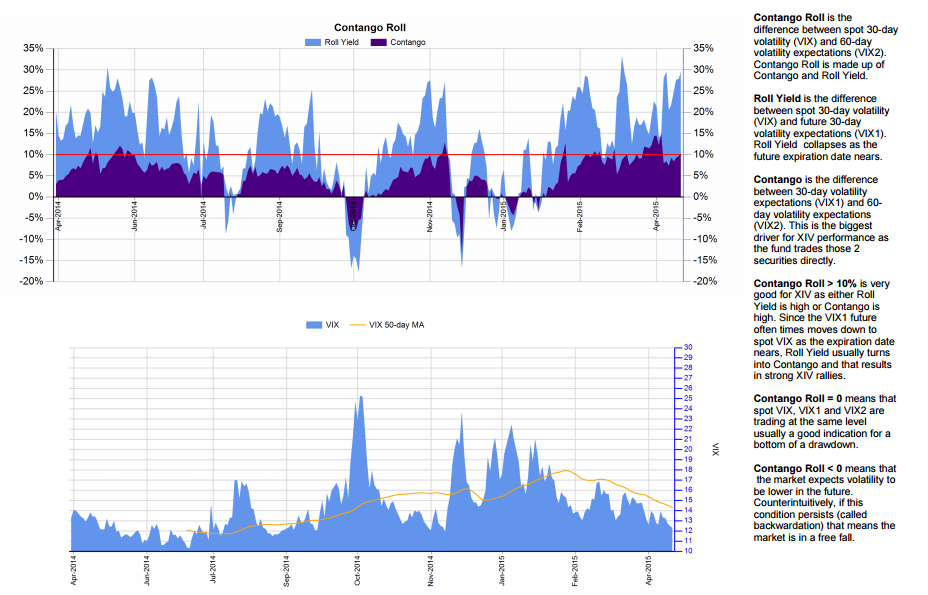 In the graph above you see how the purple (Contango) tends to increase and fill out the blue (Roll Yield) as the option expiration nears. As the Contango gets bigger, the SVXY gains more and more.
That is why the SVXY does great in the second and third weeks of the month and as the 3rd Wednesday of the month passes (VIX future expiration date),
the Contango gets reset back to a smaller value, Roll Yield to a bigger value and the SVXY struggles a bit if there are no underlying changes in the
spot VIX or SPX. As a result it is useful to track the Contango Roll especially early in the month even if most of its composition comes from Roll Yield
(as Roll Yield itself doesn’t contribute anything to SVXY performance). If the situation stays the same, Roll Yield will turn into Contango and the SVXY
gains will rack up.
In the graph above you see how the purple (Contango) tends to increase and fill out the blue (Roll Yield) as the option expiration nears. As the Contango gets bigger, the SVXY gains more and more.
That is why the SVXY does great in the second and third weeks of the month and as the 3rd Wednesday of the month passes (VIX future expiration date),
the Contango gets reset back to a smaller value, Roll Yield to a bigger value and the SVXY struggles a bit if there are no underlying changes in the
spot VIX or SPX. As a result it is useful to track the Contango Roll especially early in the month even if most of its composition comes from Roll Yield
(as Roll Yield itself doesn’t contribute anything to SVXY performance). If the situation stays the same, Roll Yield will turn into Contango and the SVXY
gains will rack up.
 So the SVXY does best when people are really complacent about the present but really scared about the future and what that means is that the market
usually is on a cusp of 30 point drop any day of the week. This is what makes determining whether to stay in the SVXY a bit of a challenge once it
starts to rack up the gains because it can serve you a -10% loss at any time. Yes you can get 1% tomorrow, but you can lose 10% too. This is akin
to picking up dollar bills in front of a steam roller. Ideally, you have made a good gain and you can place some tighter stops and not worry about
losing your profits.
So the SVXY does best when people are really complacent about the present but really scared about the future and what that means is that the market
usually is on a cusp of 30 point drop any day of the week. This is what makes determining whether to stay in the SVXY a bit of a challenge once it
starts to rack up the gains because it can serve you a -10% loss at any time. Yes you can get 1% tomorrow, but you can lose 10% too. This is akin
to picking up dollar bills in front of a steam roller. Ideally, you have made a good gain and you can place some tighter stops and not worry about
losing your profits.
While you can track 10 different indicators to determine what will happen in the future with SVXY and SPY,
you can just use the combined wisdom of all market participants for the next 90 days via one number in the VIX Contango Oscillator.
The VIX Contango Oscillator measures the level of near term complacency vs long term fear very well as it includes the spot price of the VIX in
addition to the Contango. So as the VIX moves higher and Contango decreases, the VCO will move lower. As a result once the VCO crosses 25 on the
way down, you want to have placed your stop loss orders or have gotten out altogether. There is always another rally, go to cash and think later.
As the VCO starts to move up from negative to positive or in general starts to move higher, future expectations for volatility are starting to go
down, Contango is increasing and at this point you want to be going long both SVXY and SPY as the rally is just starting to gain strength.
VIX Term Roll Oscillator (VTRO)
After using the VCO for a couple of years, I felt that the formula wasn’t complete. While the VCO is excellent for trading the SVXY, it fell short with the SPY.
I wanted to take into consideration the more immediate volatility expectations (VIX9D) as well as the more distant ones (VIX3M).
I also felt that the VCO was a little too choppy of an indicator for timing the SPY. It was too volatile and didn’t provide as smooth and as
definitive of a signal as I would’ve liked. Part of that was the VIX future expiration date effect on contango and roll yield which accounted
for some really choppy action in the middle of the month that wasn’t relevant to the direction of the SPX. To compensate for all these deficiencies,
I came up with the VIX Term Roll Oscillator or VTRO for short.
The VTRO formula is as follows:
VIX Term Roll Oscillator = MA(3) of (1000 * ((21/84)*(VIX/VIX9D – 1) + ((84 - T2) /84)*(VX1/VIX – 1) + (VX2T/84)*(VX2/VX1 – 1) +(T1/84)*(VIX3M/VX2 – 1)))
or in other words
VIX Term Roll Oscillator = MA(3) of (1000 * ((21/84)*VIX9D Roll + ((84 - T2) /84)*Roll Yield + (VX2T/84)*Contango +(T1/84)*VIX3M Roll))
where MA(3) = 3-day Moving Average
The inclusion of the VIX9D Roll and VIX3M Roll now adds VIX9D and VIX3M to the formula. VIX9D and VIX3M represent 9-day and 3-month volatility expectations
respectively. The 3 day Moving Average serves to smooth out the monthly distortions around the VIX future expiration date where the Roll Yield
drops dramatically to 0 for a day or two right before the expiration date and then recovers to a big value after wards. By taking a 3 day moving
average, the formula smoothes out that effect while still providing a timely and relevant for short-term trading VTRO value. And finally,
the weighting takes into account the term length for which volatility expectations are relevant. Let’s delve into the weights a little more.
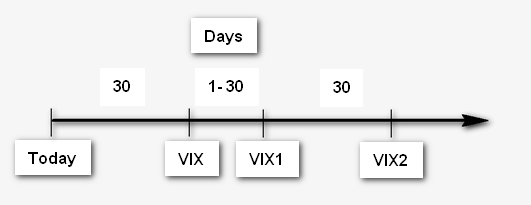
As you can see VIX9D represents volatility expectations for 9 days out, VIX for 30 days out and VIX3M for 3 months out. VX1 and VX2 are a
little more complicated. VX1 usually is between 1 and 30 days out from VIX and VX2 is usually between 30 to 60 days out in front of VIX.
So VX1 and VX2 represent expectations from 30 to 90 days. However, since the VX1 and VX2 futures have fixed expiration dates, the amount
of time into the future varies. In the beginning of the future term, VX1 represents 60 day expectations and VX2 – 90 day expectations,
while at the end of the future term VX1 represents 30 day and VX2 – 60 day expectations. The formula takes into account that variability
by using the “VX1 Term" and "VX2 Term" variables represented by T1 and VX2T respectively.
The VIX Term Roll Oscillator improves on the VCO as market timing indicator by taking into account two more volatility
terms and smoothes out the volatility around the VIX futures expiration date by taking a 3 day average. The VTRO is a better, more
timely, more accurate, more deterministic and less prone to false positives indicator.
Now, if you are paying attention, I am not using T1 as a weight for Roll Yield and 84-T2 for VIX3M Roll, but vice versa – 84-T2 for Roll Yield and T1 for VIX3M Roll. The reason is that Roll Yield tends to be
highest in the beginning of the term when T1 is at its highest of around 30. So that would assign a stronger weight to a value that is further out
into the future, whereas a stronger weight has to be assigned the closer we are to the present. Reversing out those weights accomplishes that.
The weights for VIX9D Roll are fixed at 21 and 30 as VIX9D and VIX are always 21 days apart. Contango weight is exactly VX2T and VX2T average about
30 days but in some months it is 28 and in others it can go up to 35 as the 3
rd Wednesdays are farther apart. The denominator 84,
represents the total amount of time from VIX9D to VIX3M which is exactly 84 days (93 – 9).
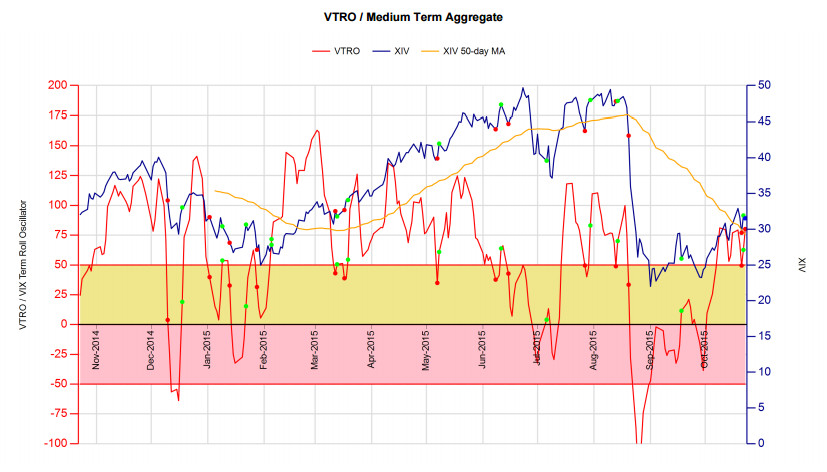 That formula yields a VTRO that generally oscillates from -100 to 100 (although these values can be exceeded) just like the VCO and when it hits 0
that usually represents a turning point in volatility expectations. The VTRO spends most of its time in positive territory however and the key levels
to watch are 50 and 0. When VTRO hits 50 on the way down, it is prudent to put stops on your long SVXY & SPY trades or get out altogether. When
VTRO hits 0 on the way up, this is a good entry point for SVXY and SPY. When it hits 50 if it hasn’t hit 0 on the way up already, this is also a good
buy point for SVXY and SPY.
That formula yields a VTRO that generally oscillates from -100 to 100 (although these values can be exceeded) just like the VCO and when it hits 0
that usually represents a turning point in volatility expectations. The VTRO spends most of its time in positive territory however and the key levels
to watch are 50 and 0. When VTRO hits 50 on the way down, it is prudent to put stops on your long SVXY & SPY trades or get out altogether. When
VTRO hits 0 on the way up, this is a good entry point for SVXY and SPY. When it hits 50 if it hasn’t hit 0 on the way up already, this is also a good
buy point for SVXY and SPY.
Library of Volatility Signals
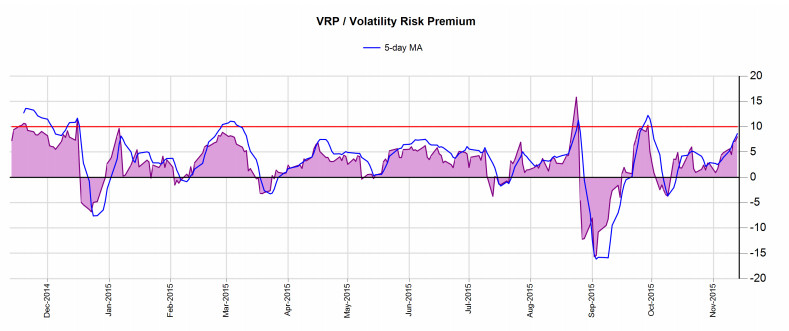
Volatility Risk Premium (VRP)
Presently VRP is the most popular volatility trading system. Most of the websites that sell volatility strategies out there have a signaling system that is based on VRP.
Volatility Risk Premium was popularized by the paper Easy Volatility Investing written in April, 2013 by Tony Cooper of Double Digit Numerics.
This is about as complete a paper on volatility as you would find for free on the internet. There are other good papers written by research arms of major banks, but they are not available for free on the internet.
Tony Cooper does a great job of explaining the basis for the system:
The basis for this strategy is that in order to earn higher returns than the risk-free rate investors must take on some risks. The extra returns that taking on these risk provide are called risk premia.
The most famous, perhaps, is the equity risk premium which is the excess return that the stock market provides over a risk-free rate.
The premium that we seek to exploit is the Volatility Risk Premium (VRP) which is the premium that an
investor in some asset pays to reduce exposure to the volatility of the future returns of that asset. In other
words, the price hedgers are prepared to pay to speculators to offload price risk. In our case the asset is
the S&P500 index.
The VRP is reflected in S&P500 options by options being overpriced. Sellers of these options (who are
essentially “selling volatility”) receive the VRP through these higher prices. Now the VIX is a measure
of the “implied” volatility of these options therefore the VIX is too high compared to where it should be
if it were an unbiased predictor of future S&P500 volatility.
In a nutshell the VIX overpredicts the S&P500 volatility and this overprediction represents the VRP.
The VRP paper introduces the following powerful signal for trading volatility (quoted here verbatum):
If the 5 day moving average of (VIX - 10 day Historical Volatility) > 0 go long SVXY else go long VIXY
VRP = VIX - HV10. The 10-day historical volatility is called HV10 on this site and can be seen live in the top ticker (you have to scroll to see).
On the Volatility Analytics report you can monitor the VRP and its 5 day moving average on a daily basis. The VRP is also displayed in real-time on the top ticker bar.
Obviously, the VRP definition is not rigid. Traders may use different measures of Historical Volatility such as 5-day or 20-day depending on their strategy, but ultimately
any strategy that compares the VIX against Historical Volatility is a VRP-based strategy. We utilize and display on the site here the most widely used definition of VRP.
Despite its popularity, a simple crossover strategy of the VRP at the 0 level produced some of the worst results in our backtests.
The SVXY portion of the VRP backtest produced CAGR of 15.18% with Maximum Drawdown of -62.7% which is slightly
worse than a buy-and-hold of SVXY (CAGR 26.9% Max Draw -74.4%). The VIXY portion resulted in pretty much a complete loss of principal.
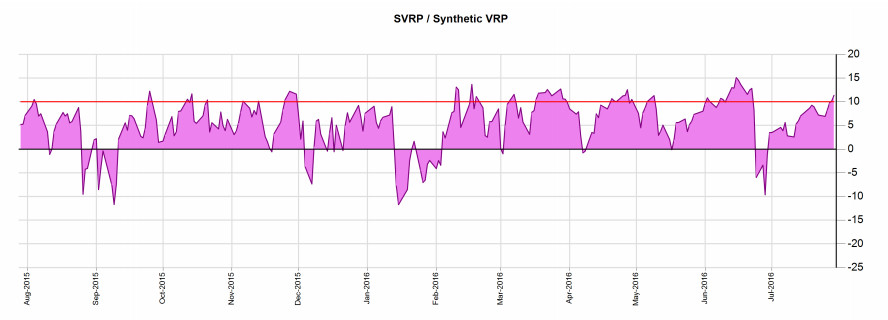
Synthetic VRP (SVRP)
The SVRP is the 5-day Exponential Moving Average (EMA) of the Synthetic 30-day VIX future and 2-day Historical Volatility minus 1. SVRP = EMA5(VX30 - HV2) - 1. This measure is a
a bit smoothed by the synthetic future and its comparison to a very fast HV2 gives early warnings to reversals in the volatility situation. Added by popular demand.
If SVRP > 0 go long SVXY else go long VIXY
On the Volatility Analytics report you can monitor the SVRP on a daily basis.
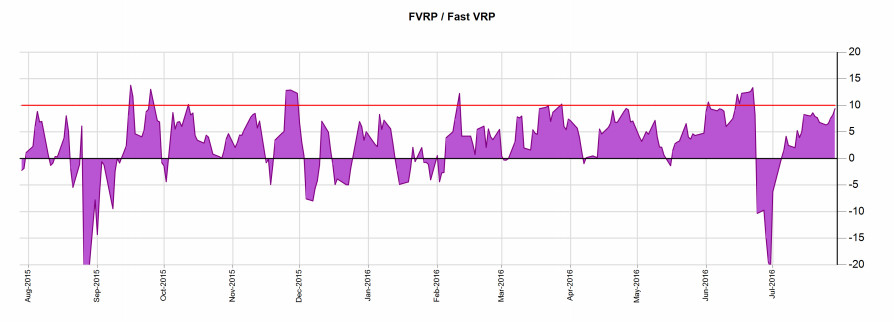
Fast VRP (FVRP)
The FVRP is the 7-day EMA of the VIX - 5-day Historical Volatility. FVRP = EMA7(VIX) - HV5.
This measure is a little faster than the VRP but all in all roughly similar in impact. Added by popular demand.
This indicator can be seen live in the top ticker bar.
If FVRP > 0 go long SVXY else go long VIXY
On the Volatility Analytics report you can monitor the FVRP on a daily basis.
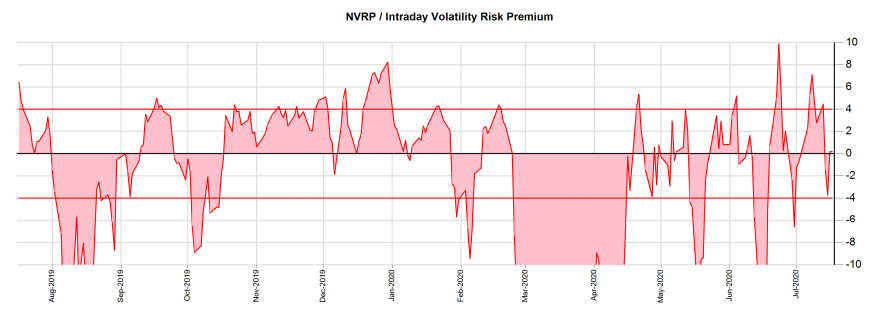
Intraday VRP (NVRP)
NVRP = VIX - NV5. NV5 is the intraday volatility of the SPX, the annualized 5-day moving average of the SPX intraday range (intraday high - intraday low).
This is the fastest VRP measure and is prone to serious whiplash, but it identifies trend changes in the VIX earlier than other measures.
This indicator can be seen live in the top ticker bar.
If NVRP > 0 go long SVXY else go long VIXY
On the Volatility Analytics report you can monitor the NVRP on a daily basis.
Volatility Momentum (Speed)
Volatility is mean reverting, but unlike a sine wave, it does not gradually go up and down. The VIX chart is more like a heartbeat chart. Violent spikes followed by small consolidations and then long decays.
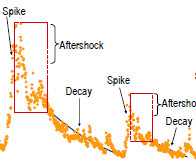 The VIX has three distinct phases - Spike, Aftershock and Decay. The Spike is quick and fast and overshoots way to the upside. The Aftershock is a little longer and the Decay lasts forever. This behaviour means that when
the VIX overshoots a moving average, it will overshoot it by a lot quickly and when it falls below the moving average, it will stay there for a long period of time. The Decay phase is when the VIX Futures Curve is in high contango leading to
outsize gains in the SVXY. So it is important to monitor whether the VIX is currently above or below a certain average. The downside to this signal is that because it uses a moving average, it is a little delayed so exit out of SVXY or entry into VIXY may come a little
later than it should. But it is a powerful signal to monitor nonetheless.
The VIX has three distinct phases - Spike, Aftershock and Decay. The Spike is quick and fast and overshoots way to the upside. The Aftershock is a little longer and the Decay lasts forever. This behaviour means that when
the VIX overshoots a moving average, it will overshoot it by a lot quickly and when it falls below the moving average, it will stay there for a long period of time. The Decay phase is when the VIX Futures Curve is in high contango leading to
outsize gains in the SVXY. So it is important to monitor whether the VIX is currently above or below a certain average. The downside to this signal is that because it uses a moving average, it is a little delayed so exit out of SVXY or entry into VIXY may come a little
later than it should. But it is a powerful signal to monitor nonetheless.
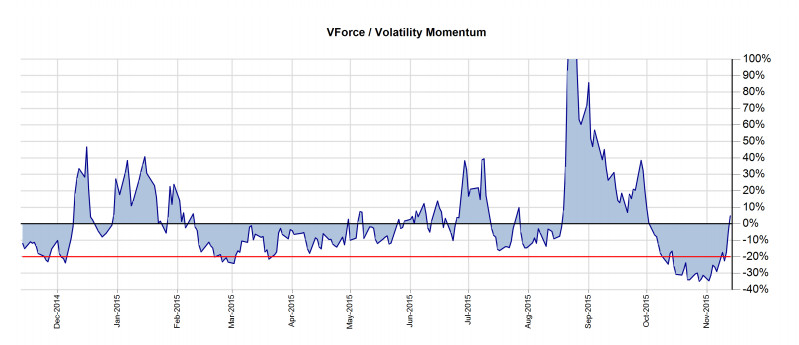
Medium Term Volatility Momentum (VForce)
VForce = VIX/VIX 50MA - 1. VForce is the distance in percentage terms of VIX from its 50-day moving average.
This signal is very important and can be seen live in the top ticker bar.
Many volatility trading algos use it.
If the VForce < 0%, go long SVXY else go long VIXY
The SVXY portion of the VForce < 0% backtest produced CAGR 23.7% with Max Draw -42.9%. The VIXY portion of the VForce > 0% backtest resulted in almost complete loss of principal with CAGR -45.6% and Max Draw -98%.
On the Volatility Analytics report you can monitor the VForce, the VIX and the 50-day moving average on a daily basis.
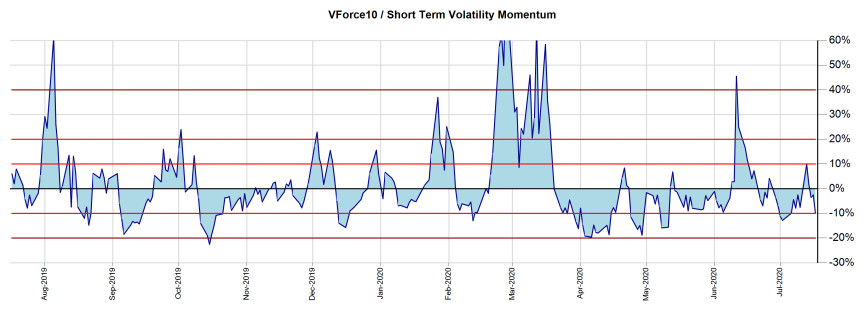
Short Term Volatility Momentum (VForce10)
VForce = VIX/VIX 10MA - 1. VForce is the distance in percentage terms of VIX from its 10-day moving average.
This signal is very fast and very important and can be seen live in the top ticker bar. Many volatility trading algos use it.
If VForce10 < 0% go long SVXY else go long VIXY
On the Volatility Analytics report you can monitor the VForce10 on a daily basis.
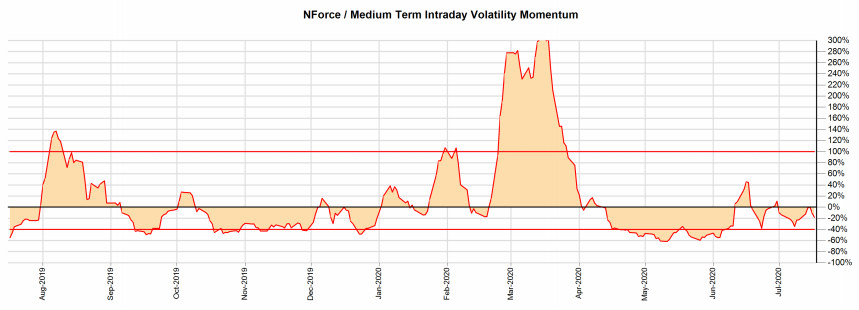
Medium Term Intraday Volatility Momentum (NForce)
NForce = NV5/NV5 50MA - 1. NForce is the distance in percentage terms of NV5 from its 50-day moving average.
This signal can be seen live in the top ticker bar.
If NForce10 < 0% go long SVXY else go long VIXY
On the Volatility Analytics report you can monitor the NForce on a daily basis.
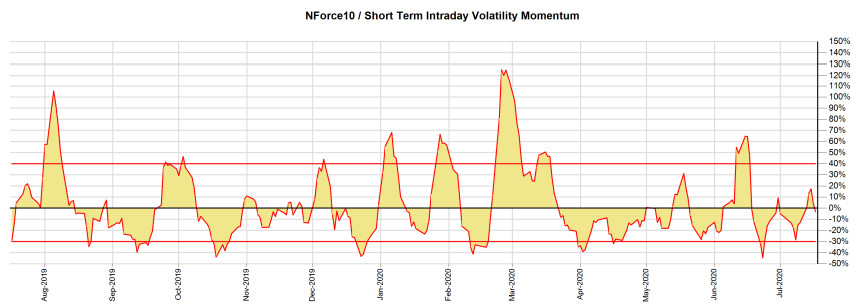
Short Term Intraday Volatility Momentum (NForce10)
NForce10 = NV5/NV5 10MA - 1. NForce is the distance in percentage terms of NV5 from its 10-day moving average.
This signal is very fast and can be seen live in the top ticker bar.
If NForce10 < 0% go long SVXY else go long VIXY
On the Volatility Analytics report you can monitor the NForce10 on a daily basis.
Turbulence (Volatility Acceleration)
Because volatility tends to accelerate rapidly on the way up, monitoring the acceleration of volatility itself can also provide a clue as to whether there is a spike in the offing. Alternatively,
volatility tends to decline slowly so a rapid deceleration of volatility is a precursor to a long period of complacency.
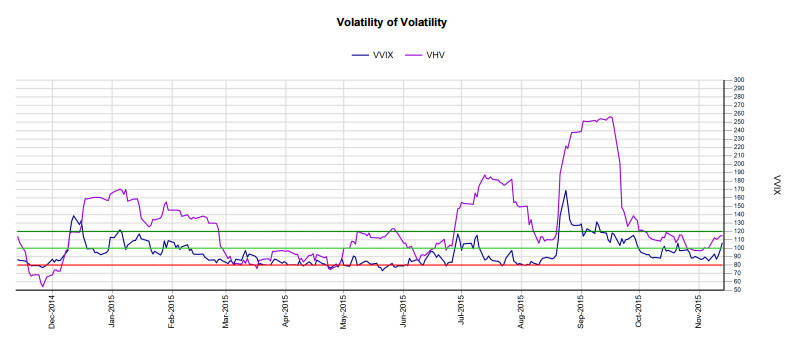
Volatility of Volatility (VVIX)
There is an index provided by the CBOE that tracks Volatility of Volatility - VVIX - the 1-month Expected VIX Volatility.
- If the VVIX crosses 100 on the way down, go long SVXY
- If it crosses 120 on the way up, go long VIXY.
- Readings below 80 suggest a lot of complacency, close SVXY longs
The SVXY portion of the VVIX < 100 resulted in CAGR 23.1% and Max Draw -46.8%. The VIXY portion of the VVIX > 120 backtest resulted in CAGR 4.24% and Max Draw -21.75%.
Historical Volatility of Volatility (VHV)
To complement the CBOE index, we have created a measure that tracks VIX Historical Volatility (VHV) similar to the Historical Volatility (HV) measure commonly used on the SPX.
The VHV measures 1-month Historical Volatility of the VIX. VHV tends to trail VVIX spikes and tends to stay elevated long after VVIX declines. However, when VHV bottoms that is usually a time when Volatility hits maximum complacency level and usually a volatility spike
is in the offing. As such it is useful to track it in terms of gauging when it is prudent to start closing short volatility positions.
- If the VHV crosses 100 on the way down, consider closing SVXY longs
- Readings below 80 suggest a lot of complacency, definitely close SVXY longs
You can see the current reading on Yahoo Finance by typing in ^VVIX. VVIX charts are not readily available, but you can see them here along with VHV on the Volatility Analytics report.
The key levels of 80, 100 and 120 are highlighted.
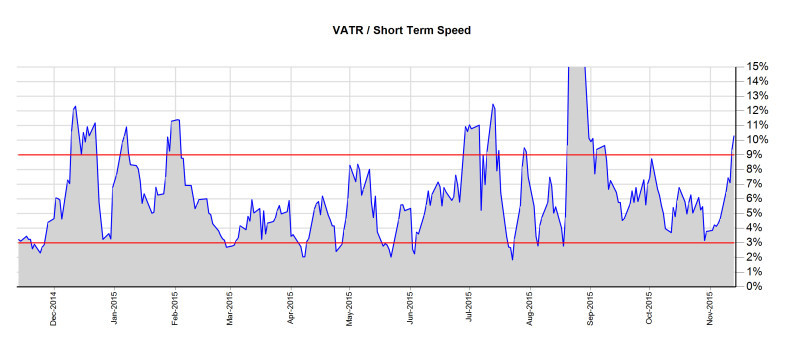
Volatility Average True Range (VATR)
Average True Range represents the average daily volatility of a stock. An easy way to calculate the ATR is to take the absolute daily returns and then average that movement out.
The Volatility Average True Range (VATR) indicator calculates the 5-day ATR of the VIX. It is a Short Term Speed indicator that indicates occasions where the VIX spikes abruptly and rapidly.
The VATR spends majority of it's time between 3% and 9%, but when it spikes below or above these levels that represents extreme complacency or stress. VATR rarely spends more than 3 days
with VATR over 9%. While below 3% streaks are longer, they also don't last very long and are usually followed by VIX spikes.
- If the VATR crosses 9% on the way down, go long SVXY
- Readings below 3% suggest a lot of complacency, close SVXY longs
The VATR is only available on this website and you can track it on the Volatility Analytics report.
The key levels of 3% and 9% are highlighted.
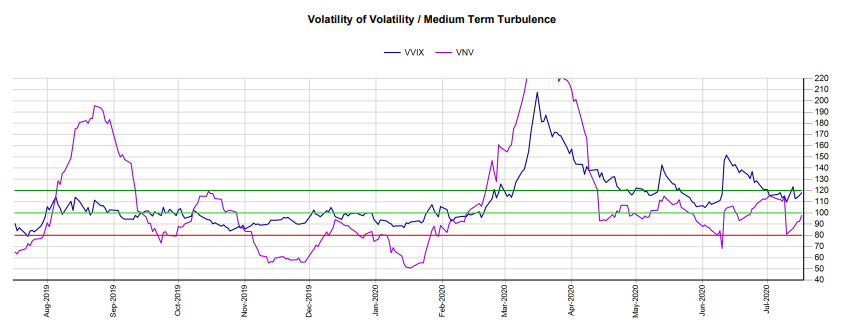
Volatility Intraday Volatility (VNV)
VNV = 20-day AVG(ABS(VIX Daily Return)) * SQRT(252) * 100. VNV is merely the annualized version of 20-day VIX Average True Range.
It makes it easy to compare VATR to VVIX and is displayed on the top ticker bar. It could provide clues as to where VVIX might be headed.
On the Volatility Analytics report you can monitor the VNV on a daily basis.
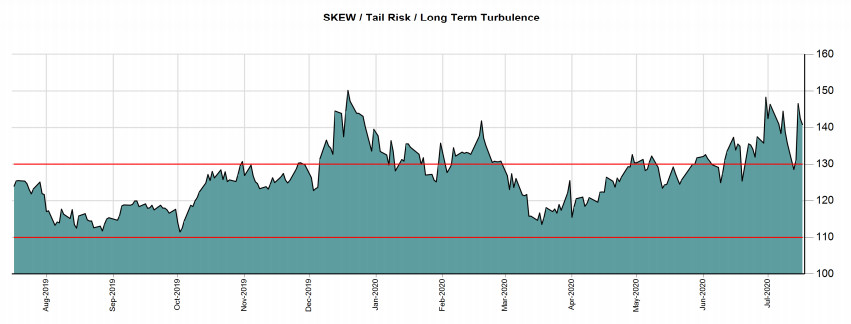
SKEW
SKEW is the CBOE S&P 500 Tail Risk index. It measures the risk of outlier returns two or more standard deviations away from the mean. In simple terms, it measures
how much premium investors are paying for long-dated Out-Of-The-Money (OTM) options known as Tail Risk insurance. Usually investors pay for Tail Risk insurance when they
are concerned that a sudden -5% to -10% move can transpire in the span of 3 days. SKEW is not a direct trading signal but is an important risk measure that
shows you how quickly money can be lost in the stock and volatility markets. When valuations are evaluated and the market has technical momentum, it is not unusual to see
a rise in tail risk hedging to protect from sudden and unexpected repricing (which happens a lot when there are fundamental overvaluations).
On the Volatility Analytics report you can monitor the SKEW on a daily basis.
Volatility Term Structure
The Volatility Term Structure is the distribution of volatility prices across time. The Volatility Curve chart on this site synthesizes the term structure in an accessible fashion.
It combines spot volatility indexes (VIX, VIX9D, VIX3M, VIX6M) and the VIX futures (VX). The Volatility Curve shape can be measured with various measures and here we will focus on the most important ones.
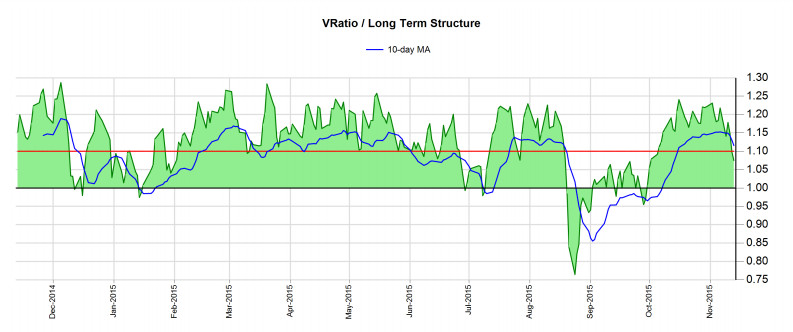
VRatio
VRatio is the ratio between VXV (the 90-day volatility index) and VIX (the 30-day volatility index). The VRatio was one of the 2 signals highlighted by Tony Cooper in his "Easy Volatility Investing" paper.
When the market is in rally mode, the VRatio is increasing, strong and above 1.1. When the market is selling off, the VRatio is decreasing, weak and below 1.0.
When market participants assign a higher price for volatility in the future, this is normal as the future is always more uncertain than the present. When market participants assign higher price to volatility over the longer term, this is
a negative as they expect selling pressure in the near term. Tony Cooper recommends smoothing the VRatio using a 10-day moving average in order to reduce the number of trades. For our backtests, we don not use the 10MA, but we use a
3-day delay between the last sale and the new buy (common in 401(k) accounts).
If VXV/VIX > 1, go long SVXY else go long VIXY
The SVXY portion of the VRatio > 1 resulted in CAGR 43.5% and Max Draw -51.7%. The VIXY portion of the VRatio < 1 backtest resulted in CAGR 6.53% and Max Draw -51%.
On the Volatility Analytics report you can monitor the VRatio, the 10-day moving average and the 1.0 and 1.1 thresholds on a daily basis.
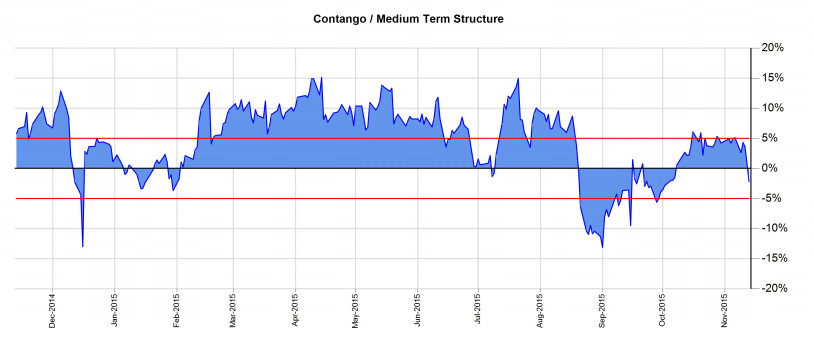
Contango
Contango is the premium that VX2 trades over VX1. When the market is in rally mode, the Contango is increasing, strong and above 5%. When the market is selling off, the Contango is decreasing, weak and below -5%.
When market participants assign a higher price for volatility in the future, this is normal as the future is always more uncertain than the present. When market participants assign higher price to volatility over the shorter term, this is
a negative as they expect selling pressure in the near term.
- If Contango > 5%, go long SVXY
- If Contango between -5% and 5%, consider going long SVXY with tight sell stops
- If Contango < -5%, go long VIXY.
The SVXY portion of the Contango > 5% resulted in CAGR 64% and Max Draw -32%. The VIXY portion of the Contango < -5% backtest resulted in CAGR -2.12% and Max Draw -31.8%.
On the Volatility Analytics report you can monitor the Contango and the 5% threshold on a daily basis.
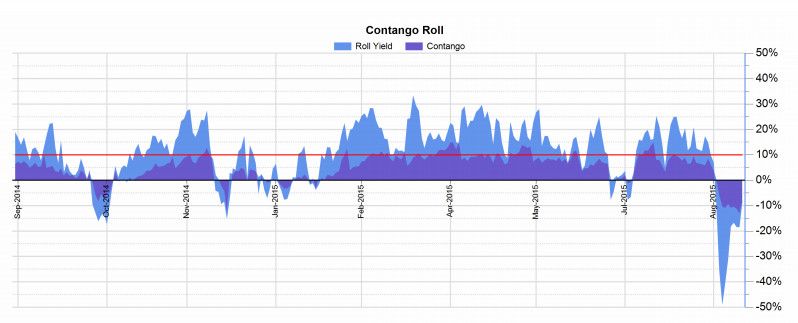
Contango Roll
Contango Roll is the premium that VX2 trades over VIX. When the market is in rally mode, the Contango Roll is increasing, strong and above 10%. When the market is selling off, the Contango Roll is decreasing, weak and below -10%.
When market participants assign a higher price for volatility in the future, this is normal as the future is always more uncertain than the present. When market participants assign higher price to volatility over the shorter term, this is
a negative as they expect selling pressure in the near term.
- If Contango Roll > 10%, go long SVXY
- If Contango between -10% and 10%, consider going long SVXY with tight sell stops
- If Contango < -10%, go long VIXY.
The SVXY portion of the Contango Roll > 10% resulted in CAGR 52% and Max Draw -37%. The VIXY portion of the Contango Roll < -10% backtest resulted in CAGR 0.82% and Max Draw -27.6%.
On the Volatility Analytics report you can monitor the Contango Roll and the 10% threshold on a daily basis.
VIX Contango Oscillator (VCO) / VIX Term Roll Oscillator (VTRO)
| VCO |
VTRO |
Description |
Trading Signal |
|
> 25
|
> 50
|
This is best for SVXY as market expects high volatility in the future while at present volatility is subdued. High Contango and Contango Roll are tailwind for SVXY adding 0.5% to 1% per day. The Volatility Curve is "Rally" formation. We're in the middle of a market melt-up.
These periods can extend for a while and be very lucrative. You can sometimes easily make 50% in a couple of months in SVXY if this condition persists.
|
HOLD
When VCO crosses 25/VTRO crosses 50 on the way UP (positive slope), this is a HOLD signal if you are already long or BUY signal if you are in cash. So long as VCO is above 25/VTRO above 50, you stay long and strong in SVXY and ignore the day to day activities. It is going higher until the volatility situation changes.
|
|
0 - 25
|
0 - 50
|
This a danger zone for SVXY especially if VCO/VTRO is on the way down. The market is attempting a drawdown, but the efforts may be rebuffed by bulls. The VIX futures curve is still in "Rally" formation, but
the Contango Roll, Contango and Roll Yield are smaller and flashing yellow and SVXY doesn't have the daily increases prevalent at higher VCO/VTRO levels.
|
SELL
When VCO crosses 25/VTRO crosses 50 on the way DOWN (negative slope), this is a SELL signal. You should sell your SVXY holdings to protect from downside. If the indicators go back to green subsequently, you may reestablish the position but you should wait at least 3 days before doing so.
|
|
-25 - 0
|
-50 - 0
|
This a danger zone for SVXY especially if VCO is on the way down as the Contango Roll is near zero. At this point the SVXY is at the mercy of the VIX as Contango has no effect on the daily calculation. The SVXY and the VIX are subject to wild fluctuations. The Volatility Curve is in "Drawdown" formation and we
are very likely in the middle of a market drawdown. However, if the indicators start to establish a bottom, we may be near the bottom of the drawdown and you should look to establish a position.
|
BUY
At this point, you should be in cash and waiting for an opportunity to buy. When VCO crosses 0/VTRO crosses 0 on the way up, this is a BUY signal.
|
|
< -25
|
< -50
|
This is terrible for SVXY as the market expects lower volatility in the future while at present the VIX is seriously spiking.
Backwardation is headwind for SVXY reducing it by 0.5% to 1% per day. The Volatility Curve is in "Bear Market" formation.
Rallies last at most a day or two and are followed by steeper declines.
|
CASH
At this point, you have to have been stopped out of your SVXY long attempts and must be completely out of SVXY and SPY.
You can consider dabbling in VIXY or shorting the market outright via short market ETF.
You may try to go long SVXY when VCO is negative but you have to wait for the VCO to turn back upwards.
Historically, the drawdown is likely to get out of hand and SVXY specifically to get especially hammered.
This is "catching a falling knife" territory and attempting longs is really for experienced day traders only.
When VCO/VTRO is negative, SVXY has had episodes where it has lost 70-80% in a week!
|
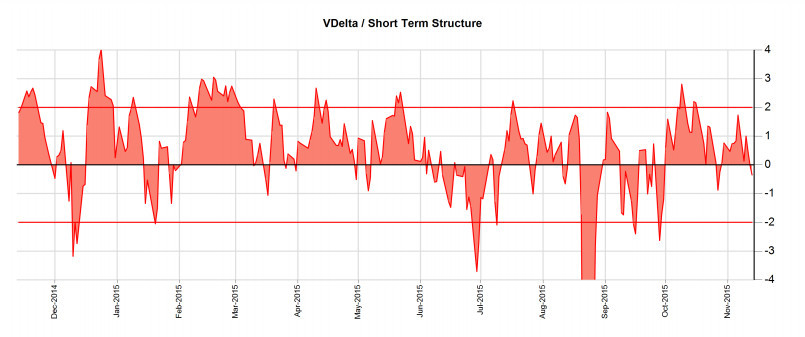
VDelta
VDelta is the difference between VIX (30-day volatility) and VIX9D (9-day volatility index). When the market is in rally mode, the VDelta is increasing, strong and above 0. When the market is selling off, the VDelta is decreasing, weak and below 0.
VDelta is a very fast indicator and very quickly can help you spot changes in volatility direction. It rarely goes to extremes, but when it does it usually is a precursor to an unusually oversold or overbought condition and a reversal is soon in play.
The key levels for VDelta are 2 and -2. When VDelta goes above 2, it usually means the rally in the SPX is about to stop as volatility is reaching maximum complacency. When VDelta goes below -2, it usually means the market is super panicked for some unknown reason and once
that panic subsides a rally will take hold.
- If VDelta > 2, close SVXY longs
- If VDelta < -2, close VIXY longs
On the Volatility Analytics report you can monitor the VDelta and the 2.0 threshold on a daily basis.
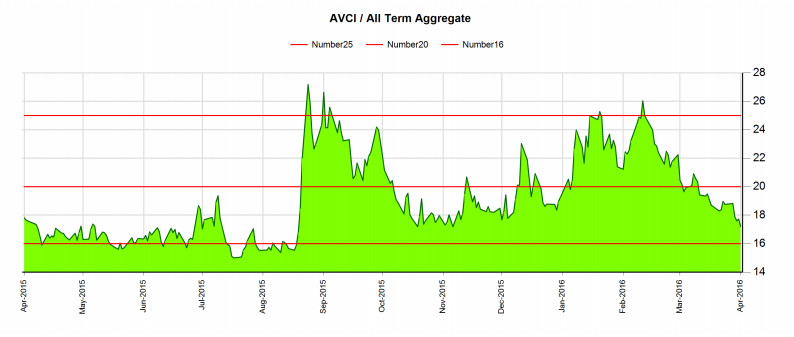
Average Volatility Curve Index (AVCI)
AVCI is the average of all CBOE spot volatility indexes and the VIX futures. The AVCI tries to capture the totality of all volatility information. As such the AVCI is a slow moving index but it
is very instructive as to where in the VIX Cycle we are. It takes a long time for fear to be wrung out of the market to where both the VIX spot and VIX futures market can be considered complacent.
When all volatility markets become complacent, when all fear has been quelled is when the VIX Cycle can resume again. Until then, so long as there is some fear, the AVCI has room to go down.
When the market is in rally mode, the AVCI is declining or bouncing around in the 16 to 20 range, as either the spot indexes are elevated or the VIX futures are elevated. When the market is selling off, the AVCI is increasing as the entire volatility
curve is moving up and the AVCI is usually above 20. When the AVCI goes above 25, we are usually in the middle of a major bear market similar to 2008. When the AVCI is below 16, we are reaching a state of maximum
complacency and investors need to start looking towards closing short volatility positions.
- If AVCI < 16, close SVXY longs
- If AVCI < 20, go long SVXY
On the Volatility Analytics report you can monitor the AVCI and the 16, 20 and 25 thresholds.
Volatility Mean Reversion
Volatility is mean reverting by definition, so when the VIX or the VIX9D hits some extreme levels, usually a reversal is soon in sight. By analysing a historical distribution of VIX values,
we can get some pretty good idea as to which levels usually trigger a reversal.
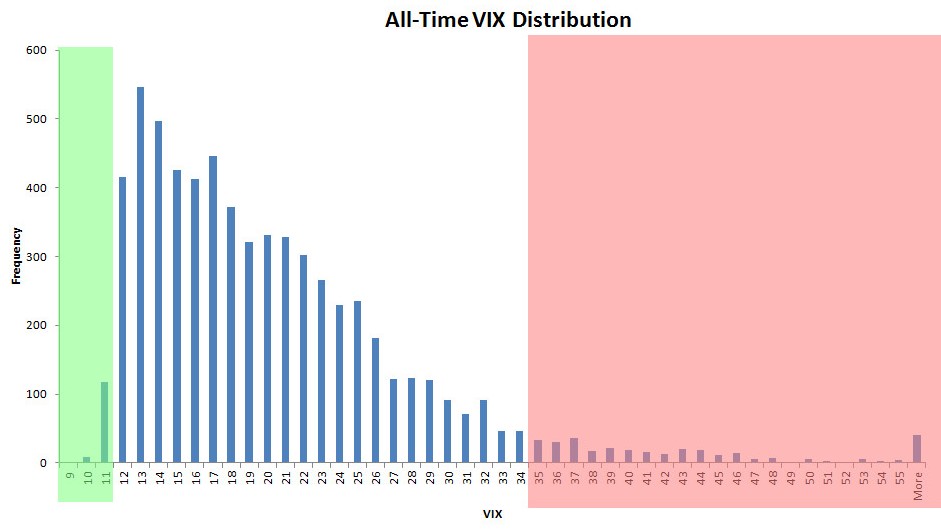
- If VIX or VIX9D < 12, close SVXY longs
- If VIX or VIX9D > 20, go long SVXY with a stop
Volatility can be extremely complacent and extremely elevated. Usually those levels provide good entry points for trades. You need to analyze not only the all time distribution of values, but also
the more recent one as well. For example, historically the extreme thresholds for VIX usually has been 12 and 35, but more recently during the QE bull market of 2012 to 2014, these levels were 12, 20 and 25.
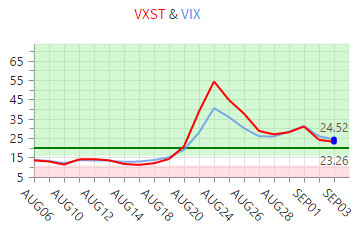
VXST also provide very powerful signals. We don't have much history on VXST, but low readings can denote extreme complacency and very high readings - extreme panic.
The strategy resulted in CAGR 55.8% and Max Draw -74.38%. So while it works most of the time, there are times where it doesn't work so well when the VIX takes off upwards.
You can monitor the levels of VIX and VIX9D as well they key threshold levels on the Volatility Signals dashboard.
Chandelier Stops
Chandelier Stops strategy utilizes ATR Trailing Stops. ATR stands for Average True Range and represents the average daily volatility of a stock.
An easy way to calculate the ATR is to take the absolute daily returns and then average that movement out.
The ATR Trailing Stop is a way to limit losses and protect profits. A stop loss order is set at the multipe of the Average True Range away from the current
stock price. As the price goes up, the stop ratchets up along.
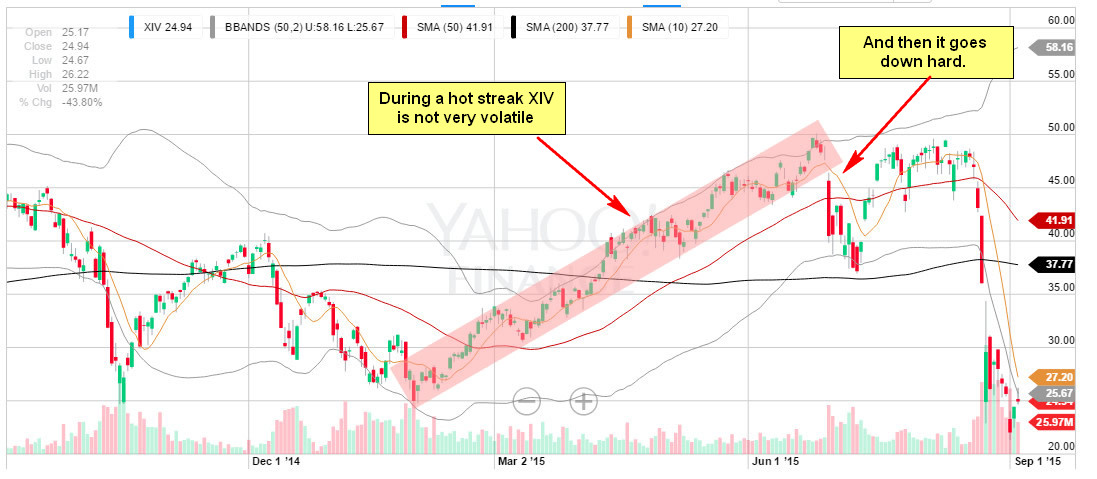
The SVXY tends to move in very defined waves. It moves up for a long time with little volatility (this is the Decay phase of the VIX spike) and
then it goes abruptly down (Spike phase). If you happen to catch SVXY on a hot streak, but don't put
in a stop loss order, your cumulative gains for months can be lost in 1 or 2 adverse trading days.
The VIX and VX futures are very volatile and can easily move up 50-60% in a 2-3 day period (see the August crash of 2015) obliterating years of gains in the SVXY.
As such a stop loss methodology is crucial.
- If SVXY trades below 2 * 1 Month ATR from the previous day close, sell SVXY. On the next day, buy again.
This ensures that you never encounter a debilitating drawdown of which the SVXY is more than capable of.
We calculate the ATR STOP loss level daily and display it on the SVXY page in the Volatility Signals Dashboard. The stop loss percentage from the prior day close is also displayed.
As the streak is in process especially early on the stop loss percentage is larger. As the SVXY streak ends, the volatility of the SVXY is really muted by high contango and at that point,
the sell stop tightens.
The Chandelier ATR Trailing Stops strategy resulted in CAGR 21.47% and Max Draw -70.49%.
Current Positioning
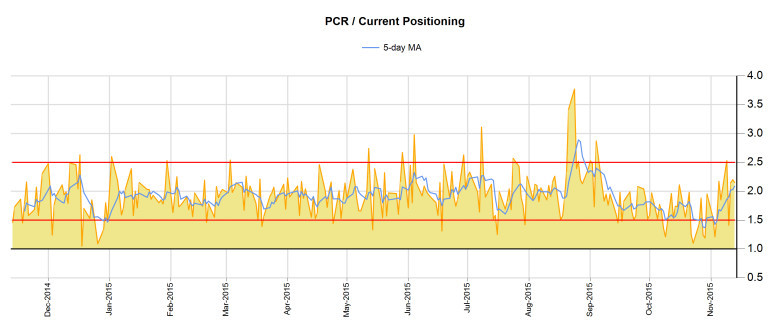
The market is very sensitive to current positioning of option participants and tends to punish extreme conditions. The current positioning in the option market can be
measured with the SPX Put/Call Ratio (SPCR) which is readily available on the CBOE website on the Intra-day Volume page.
SPCR above 2.5 represents extreme bearishness (as there are way too many puts compared to calls) and usually points to peaks in bearish activity and as such it is an excellent
contrarian indicator. PCR below 1.5 represents extreme bullishness/complacency and the market usually tends to punish those extremes with a few day selloff to clear out the weak hands.
- If SPCR > 2.5, go long SVXY/close VIXY longs
- If SPCR < 1.5, close SVXY longs/go long VIXY
The SPCR is available on this website and you can track it on the Volatility Analytics report.
The key levels of 1.5 and 2.5 are highlighted.
Backtest Setup
All backtests were performed using data for VIX ETNs XIV and VXX from their respective inception dates (Nov 30th, 2010 for SVXY and Jan 30th, 2009 for VXX).
In the past VIX ETNs like XIV and VXX are almost identical fo VIX ETFs like SVXY and VIXY. They have lower fees and a different tax treatment, but the VIX futures indexes they track
are the same and thus perform almost identically on a day to day basis. Correlations are north of 98%.
The backtest algorithms assumed the tracking portfolio was 100% invested (or as close to 100% as possible) when it went long and
0% invested when it liquidated the holdings. Industry standard slippage of 0.10% was assumed and a trading fee of $7.50 per transaction. The algorithms behaved
as if the portfolio was a 401(k) account and couldn't buy for 3 days after a sell.
In our tests, we found that slowing the buy after sell almost always improved the CAGR of any strategy we looked at. In other, less frequent trading is better.
The backtest results reflect data from inception of the underlying until October 13th, 2015.
Volatility Terminology
To track, explain and deconstruct the VIX Futures Curve, we need terminology. Some of the terminology you see here is generally accepted. Some of it is of my own creation so as to fill gaps in the generally accepted conventions.
| Term |
Description |
Formula |
| VIX9D |
1-week spot estimate for expected volatility of the S&P500 index |
|
| VIX |
1-month spot estimate for expected volatility of the S&P500 index |
|
| VIX3M |
3-month spot estimate for expected volatility of the S&P500 index |
|
| VIX6M |
6-month spot estimate for expected volatility of the S&P500 index |
|
| VX1 |
Price of the front month VIX future |
|
| VX2 |
Price of the second month VIX future |
|
| VX30 |
Synthetic 30-day VIX Future |
(30-T2)/(T-T2) * VX1 + (1 - (30-T2)/(T1-T2)) * VX2 |
| Roll Yield |
Percentage difference between VIX and VX1 |
(VX1/VIX) – 1 |
| Contango |
Percentage difference between VX1 and VX2 |
(VX2/VX1) – 1 |
| Contango Roll |
Percentage difference between VIX and VX2 (essentially a sum of Roll Yield and Contango) |
(VX2/VIX) – 1 |
| VRatio |
Percentage difference between VIX and VXV |
VXV/VIX |
| VDelta |
Difference between VIX and VIX9D |
VIX - VIX9D |
| VForce |
Percentage difference between VIX and 50-day moving average of VIX |
(VIX/VIX50MA) - 1 |
| VForce10 |
Percentage difference between VIX and 10-day moving average of VIX |
(VIX/VIX10MA) - 1 |
| NForce |
Percentage difference between NV5 and 50-day moving average of NV5 |
(NV5/NV550MA) - 1 |
| NForce10 |
Percentage difference between NV5 and 10-day moving average of NV5 |
(NV5/NV510MA) - 1 |
| HV2 |
2-day Annualized Historical Volatility of S&P500 index |
2-day STDEV(LOG(SPX Close / Previous Day Close)) * SQRT(252) * 100 |
| HV5 |
5-day Annualized Historical Volatility of S&P500 index |
5-day STDEV(LOG(SPX Close / Previous Day Close)) * SQRT(252) * 100 |
| HV10 |
10-day Annualized Historical Volatility of S&P500 index |
10 day STDEV(LOG(SPX Close / Previous Day Close)) * SQRT(252) * 100 |
| HV20 |
20-day Annualized Historical Volatility of S&P500 index |
20-day STDEV(LOG(SPX Close / Previous Day Close)) * SQRT(252) * 100 |
| NV5 |
5-day Annualized Intraday Range Volatility of S&P500 index |
5-day AVG(MAX(High, PriorClose)- MIN(Low, PriorClose)) * SQRT(252) * 100 |
| SPCR |
Put/Call Ratio of the S&P500 index |
|
| VATR |
1-week VIX Average True Range |
5 day AVG(ABS(VIX Daily Return)) |
| VHV |
1-month Annualized Historical Volatility of VIX |
20 day STDEV(LOG(VIX Close / Previous Day Close)) * SQRT(252) |
| VNV |
1-month Annualized Intraday Volatility of VIX |
20 day AVG(ABS(VIX Daily Return)) * SQRT(252) * 100 |
| AVCI |
Average Volatility Curve Index |
AVG(VIX9D, VIX, VIX3M, VIX6M, VX1, VX2, VX3, VX4, VX5, VX6, VX7, VX8)/td>
|
| VRP |
Difference between VIX and HV10 |
VIX - HV10 |
| FVRP |
Difference of EMA7 of VIX and HV5 |
EMA7(VIX) - HV5 |
| SVRP |
EMA5 of difference between VX30 and HV2 minus 1 |
EMA5(VX30 - HV2) - 1 |
| NVRP |
Difference between VIX and NV5 |
VIX - NV5 |
| T1 |
Calendar days from today to VX1 expiration |
|
| T2 |
Calendar days from today to VX2 expiration |
|
| TD1 |
Trading days from today to VX1 expiration |
|
| TD2 |
Trading days from today to VX2 expiration |
|
| VX1T |
Contract term length in calendar days of VX1 future contract |
|
| VX2T |
Contract term length in calendar days of VX2 future contract |
|
| VX1TD |
Contract term length in trading days of VX1 future contract |
|
| VX2TD |
Contract term length in trading days of VX2 future contract |
|
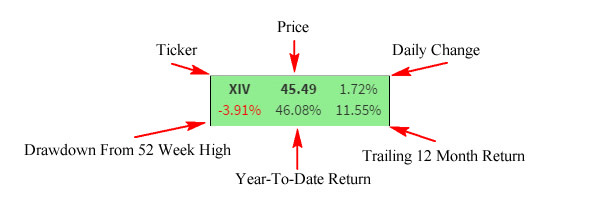
Ticker Legend
VIX Contango Ticker

| Color |
VCO |
VTRO |
VDelta |
Roll Yield |
Contango |
Contango Roll |
VRatio |
VForce |
VRP |
SPCR |
VATR |
| Green |
> 25 |
> 50 |
> 1 |
> 5% |
> 5% |
> 10% |
> 1.10 |
< 0% |
> 0 |
1.5 - 2.5 |
3 - 9% |
| Yellow |
0 - 25 |
0 - 50 |
0 - 1 |
0 - 5% |
0 - 5% |
0 - 10% |
1.00 - 1.10 |
0 - 20% |
|
< 1.5 |
< 3% |
| Red |
< 0 |
< 0 |
< 0 |
< 0% |
< 0% |
< 0% |
< 1.00 |
> 20% |
< 0 |
> 2.5 |
> 9% |
Stock Ticker
| Color |
5 Day Slope of 50 Day Moving Average |
| Green |
> 10% |
| White |
-10% - 10% |
| Red |
< 10% |